Configuring Chaffe and Finnerty DLOM in Zimbs Valetex
A technical walkthrough of how valuation analysts configure Chaffe and Finnerty DLOM models in Zimbs Valetex, covering volatility inputs, time-to-liquidity settings, and how the platform eliminates the spreadsheet errors that plague manual DLOM work.

Key Takeaways
- check_circleThe Chaffe and Finnerty models both derive DLOM from put-option pricing logic, with volatility and time-to-liquidity as the two primary inputs that drive the output.
- check_circleVolatility selection is the most judgment-intensive step: analysts typically source it from guideline public companies, and the choice materially affects the resulting discount.
- check_circleZimbs Valetex structures DLOM configuration into discrete, validated input fields, eliminating the formula-linkage errors common in spreadsheet-based DLOM models.
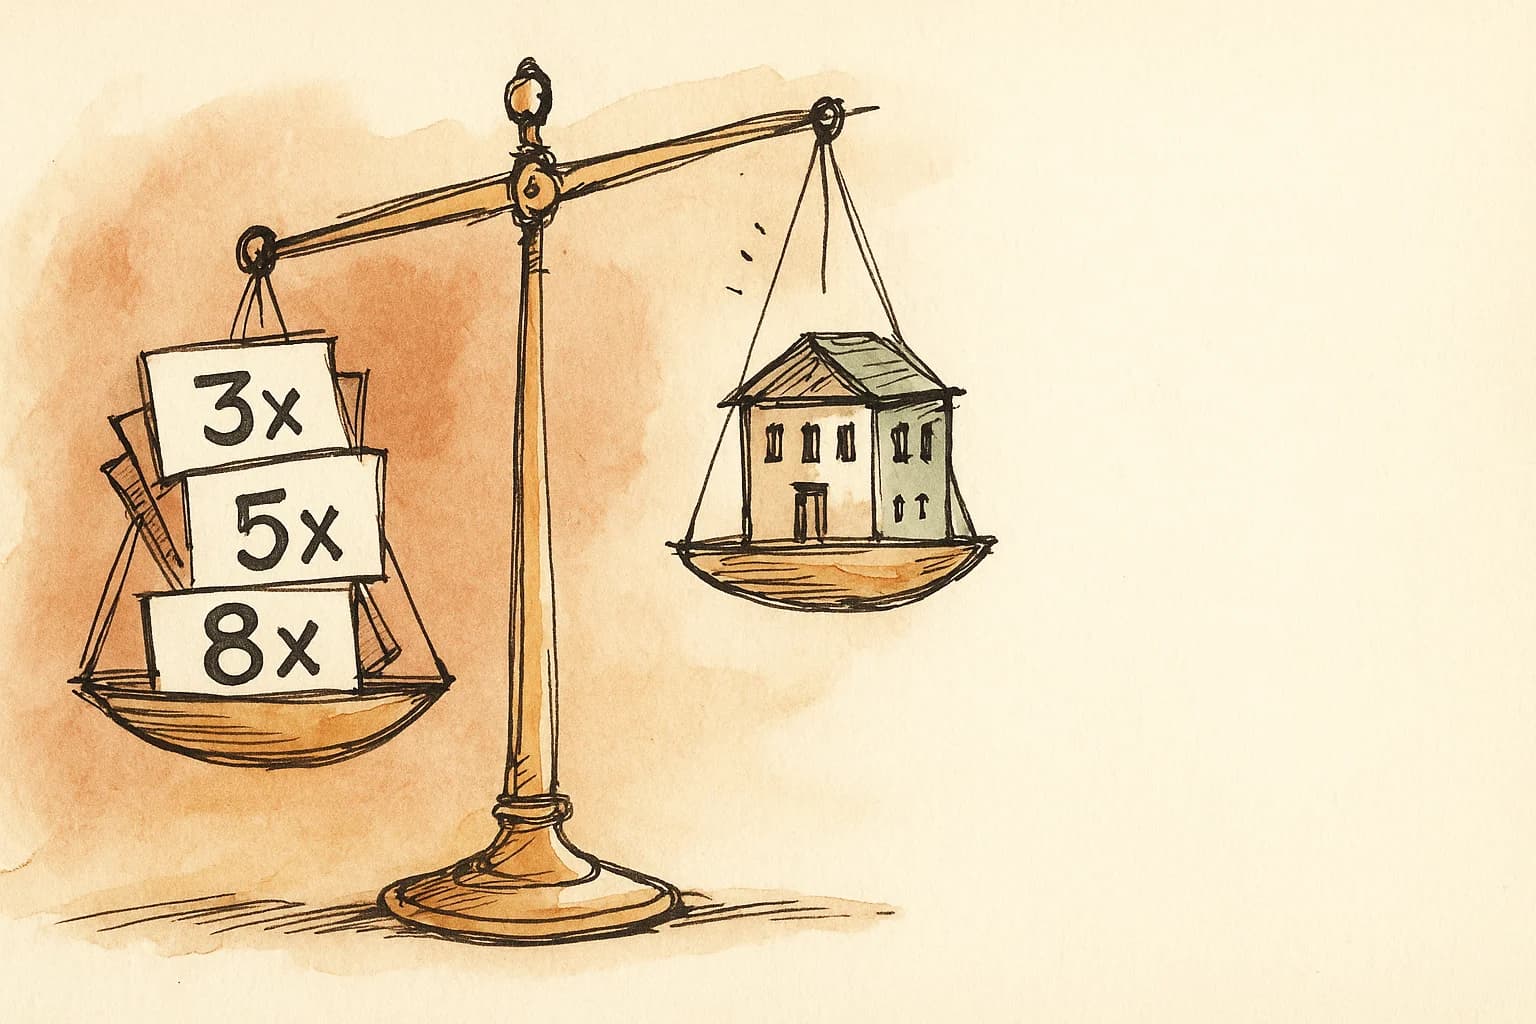
- check_circleThe platform calculates Chaffe, Finnerty, Geometric Average, and Restricted Stock DLOM models in parallel, letting analysts compare outputs before selecting a final discount.
- check_circleEvery input, assumption, and model selection is logged in the platform audit trail, making auditor review a documentation exercise rather than a reconstruction effort.
The Discount for Lack of Marketability (DLOM) step sits near the end of most 409A and ASC 820 workflows, but it carries a disproportionate share of audit risk. The inputs are judgment-driven, the models are sensitive to small changes in volatility, and the documentation requirements are real. In a spreadsheet, all of that complexity lives in a tangle of linked cells that only the original analyst fully understands. This post walks through how DLOM configuration works inside Zimbs Valetex: what inputs the platform collects, how the Chaffe and Finnerty models are structured, and what the output looks like before it flows into the allocation step.
Why DLOM Is Hard to Get Right in a Spreadsheet
Here is the thing about DLOM: the math is not the hard part. The hard part is the inputs. Both the Chaffe and Finnerty models derive the discount from put-option pricing logic, and the two primary inputs are expected holding period and expected volatility. Those two variables do most of the work. Change volatility by 10 percentage points and the implied discount moves materially. Change the holding period from one year to two and the output shifts again.
Volatility is typically estimated from guideline public companies, which means the analyst has to source it, document the selection rationale, and revisit it every engagement. In a spreadsheet, that process is informal. The volatility figure gets typed into a cell, the formula runs, and the output appears. There is no enforced link between the volatility source and the model input, no validation that the holding period is internally consistent with the rest of the engagement, and no automatic record of what changed between the prior year and this one.
The Models: Chaffe and Finnerty Side by Side
Before getting into the platform configuration, it helps to be clear on what each model actually does. Both are option-pricing-based approaches, but they use different put-option formulations.
| Model | Option Type | Primary Inputs | Key Characteristic |
|---|---|---|---|
| Chaffe | European put option on subject stock | Volatility, holding period, risk-free rate | Treats DLOM as the cost of a protective put; Chaffe based his proxy on volatilities above 60% from small OTC companies |
| Finnerty | Average-strike put option | Volatility, holding period, risk-free rate | Uses an average-strike formulation that some practitioners consider a closer proxy for actual illiquidity cost |
| Geometric Average | Blended put approach | Volatility, holding period | Averages the Chaffe and Finnerty outputs; useful when neither model alone is clearly more appropriate |
| Restricted Stock | Empirical study-based | Holding period, company characteristics | Draws on restricted stock transaction data rather than option pricing; less sensitive to volatility assumptions |
The question is not whether one model is universally correct. It is which model, or combination of models, is most defensible given the specific facts and circumstances of the engagement. That is why running them in parallel and reviewing the range of outputs matters. You can read a deeper comparison of these approaches in our post on DLOM methods compared.

Configuring DLOM in Zimbs Valetex: A Step-by-Step Walkthrough
DLOM configuration in Zimbs Valetex happens after the enterprise value and equity allocation steps are complete. The platform surfaces a dedicated DLOM module where analysts select models, enter inputs, and review outputs before the discount is applied to the final common stock value. Here is what that process looks like.
Step 1: Select the DLOM models to run
The module presents all four available models: Chaffe, Finnerty, Geometric Average, and Restricted Stock. Analysts can enable any combination. Enabling multiple models does not commit you to using all of them; it just means the platform calculates each one so you can compare the outputs. For most 409A engagements, running at least Chaffe and Finnerty together is standard practice.
Step 2: Set the volatility input
Volatility is entered as an annualized percentage. The platform accepts a single point estimate, but the input field is accompanied by a notes field where analysts document the source: which guideline public companies were used, the observation period, and any adjustments made for company-specific factors. This documentation lives inside the engagement record, not in a separate email or file.
The IRS DLOM Job Aid notes that Chaffe based his original analysis on volatilities in excess of 60% from small OTC public companies, with a two-year holding period producing a meaningful implied discount for stocks in the 60% to 90% volatility range. That historical context is useful framing, but the appropriate volatility for any specific engagement depends on the subject company's facts and circumstances. The platform does not enforce a floor or ceiling; it is up to the analyst to select and document a defensible figure.
Step 3: Set the time-to-liquidity input
Time-to-liquidity is entered in years and represents the analyst's estimate of how long a hypothetical investor would need to hold the subject interest before a liquidity event becomes possible. This is a judgment call. For an early-stage company with no near-term exit visibility, a longer period is appropriate. For a company that has recently filed for an IPO or signed a letter of intent for an acquisition, a shorter period may be warranted.
The platform validates that the time-to-liquidity input is a positive number and flags it if it falls outside a reasonable range, but it does not override analyst judgment. The field is also linked to the engagement's valuation date, so the platform can flag cases where the holding period assumption appears inconsistent with known facts about the company's stage or recent transactions.
Step 4: Review the parallel model outputs
Once inputs are saved, the platform calculates all enabled models simultaneously and displays the results in a side-by-side summary. Analysts can see the implied DLOM from each model, the spread between the highest and lowest output, and the Geometric Average if that model was enabled. This parallel view is where the real analytical work happens: if Chaffe produces 28% and Finnerty produces 22%, the analyst needs to decide whether to weight one more heavily, use the average, or document a rationale for selecting a point within the range.
The platform does not make that selection automatically. It surfaces the data; the analyst makes the call. That is the right division of labor. What the platform eliminates is the risk that the Chaffe tab and the Finnerty tab in a spreadsheet are using different volatility figures because someone updated one and forgot the other.
Step 5: Select and apply the final DLOM
After reviewing the model outputs, the analyst enters the selected DLOM percentage and a brief rationale. The platform applies that discount to the common stock value from the allocation step and recalculates the indicated fair market value (FMV) of common stock. The selected DLOM, the model outputs it was derived from, and the documented rationale all appear in the generated report.

What the Audit Trail Captures
Every input entered in the DLOM module is timestamped and logged. If the volatility figure changes between the draft and the final engagement, the audit trail shows when it changed, what it changed from, and which user made the update. The same applies to the holding period, the model selection, and the final DLOM percentage.
This matters because auditors do not just review the final output. They review the process. A complete, timestamped record of how the DLOM was derived is a much stronger position than a spreadsheet with a single cell containing a percentage and no history of how it got there. For firms doing ASC 820 work, where the fair value measurement standard demands documented inputs and assumptions, this kind of trail is not optional.
Where DLOM Fits in the Broader Workflow
DLOM does not exist in isolation. The discount is applied to a common stock value that comes out of the allocation step, which in turn depends on the enterprise value derived from the methodology step. In a spreadsheet workflow, those three steps typically live in separate tabs or separate files, and the connections between them are manual. An analyst who updates the enterprise value has to remember to recalculate the allocation and then re-enter the post-DLOM common stock value in the report template.
In Zimbs Valetex, the steps are connected. When the enterprise value changes, the allocation recalculates. When the allocation recalculates, the pre-DLOM common stock value updates. When the analyst confirms the DLOM, the final FMV of common stock updates in the report. No manual transfers. If you have ever spent an afternoon tracing a discrepancy between a valuation model and a report template, you know exactly what that kind of end-to-end connection is worth.
For firms that are still running this workflow in spreadsheets, the post on modernizing valuation practice covers the broader case for moving to a purpose-built platform. The DLOM module is one piece of that picture, but it is a representative one: it is exactly the kind of calculation where the cost of a formula error is high and the benefit of structured, validated inputs is immediate.
The Practical Difference for Your Team
The question is not whether your team can run a Chaffe or Finnerty model in a spreadsheet. They can. The question is whether the spreadsheet gives you any confidence that the inputs are consistent, the formulas are intact, and the documentation will hold up when an auditor asks to see the basis for the discount.
Structured input fields do not replace analyst judgment. They protect it. When the volatility source is documented in the same system as the model output, and when the audit trail shows exactly what changed and when, the analyst's judgment is on record in a way that a spreadsheet cell never achieves. That is what good looks like for DLOM configuration: not a more complicated model, but a more defensible process around the same model.
Frequently Asked Questions
What are the primary inputs to the Chaffe and Finnerty DLOM models?expand_more
Both models rely on two primary inputs: expected holding period (time-to-liquidity) and expected volatility. Volatility is typically estimated using representative publicly traded guideline companies. The holding period reflects how long an investor would need to wait before a liquidity event becomes possible. Small changes in either input can produce meaningful swings in the resulting DLOM percentage.
How does volatility affect the DLOM output?expand_more
Higher volatility generally produces a higher DLOM because the theoretical cost of a put option rises as the underlying asset becomes more uncertain. According to the IRS DLOM Job Aid, Chaffe based his proxy discount on volatilities in excess of 60% drawn from small OTC public companies. Analysts should document their volatility source carefully, as auditors will scrutinize year-over-year changes.
Why does DLOM change during periods of market volatility?expand_more
DLOM models that use public market inputs are sensitive to prevailing market conditions. When public market volatility rises, the implied cost of illiquidity rises with it, pushing DLOM higher. BDO has noted that DLOMs applied to private company valuations should reflect current market volatility as well as the specific equity class within the cap table. Sporadic or unexplained changes in DLOM can trigger extended auditor discussions.
What is the difference between the Chaffe and Finnerty DLOM models?expand_more
Both are option-pricing-based approaches, but they use different put-option formulations. The Chaffe model prices a European put option on the subject stock, treating the DLOM as the cost of that put. The Finnerty model uses an average-strike put option, which some practitioners consider a closer proxy for the actual illiquidity cost. In practice, analysts often run both and consider the range of outputs.
How does Zimbs Valetex handle DLOM in the valuation workflow?expand_more
Zimbs Valetex includes built-in Chaffe, Finnerty, Geometric Average, and Restricted Stock DLOM models. Analysts configure volatility and time-to-liquidity inputs in structured fields, and the platform calculates all models in parallel. The selected DLOM flows directly into the equity allocation step without manual transfer, and every input is logged in the audit trail.
Can the platform run multiple DLOM models at the same time?expand_more
Yes. Zimbs Valetex calculates Chaffe, Finnerty, Geometric Average, and Restricted Stock models simultaneously from the same set of inputs. Analysts can review the full range of outputs side by side before selecting the final discount to apply. This parallel calculation is not practical in a spreadsheet environment without maintaining separate, error-prone model tabs.
What volatility level did Chaffe use as the basis for his DLOM analysis?expand_more
According to the IRS DLOM Job Aid, Chaffe determined his DLOM proxy using volatilities in excess of 60%, based on analysis of small OTC public companies. He found that a stock with a two-year holding period and volatility between 60% and 90% produced a meaningful implied discount. Analysts working with companies outside that volatility range should document their rationale for any adjustments.
Run audit-ready valuations in one platform
DCF, GPC, backsolve, OPM/CVM, cap tables, built for CPA firms and valuation advisors. See a walkthrough tailored to your practice.